
The New Map of International Education After the Big Four Tightened
Where students, degrees and campuses moved from 2023 to 2026, and how an institution can choose its route
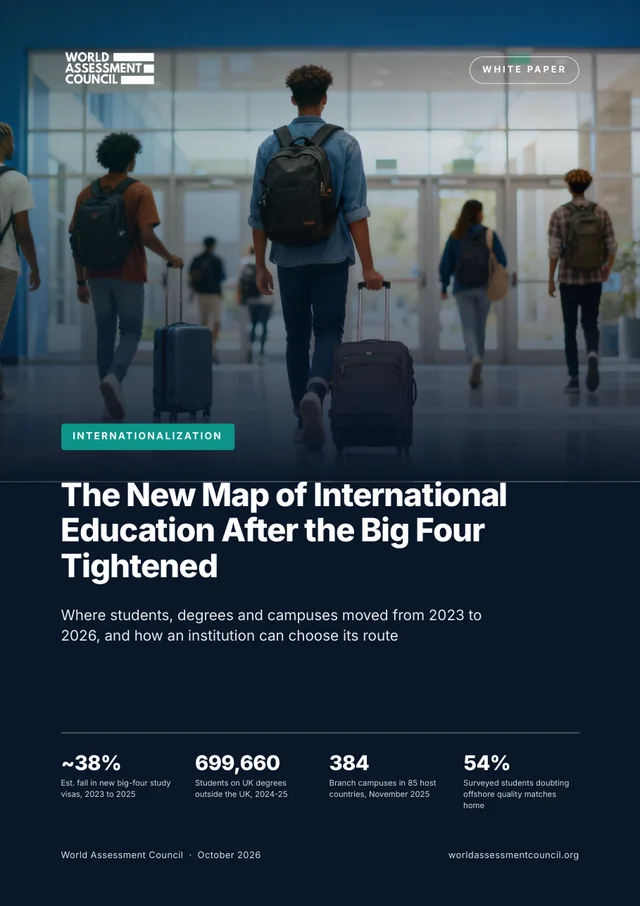
Since 2024 the United States, United Kingdom, Canada and Australia have all restricted student entry, and new study visas across the four fell by an estimated 38 percent between 2023 and 2025. This paper reviews where students, degrees and campuses went instead, what that means for quality assurance and recognition, and offers a Four Routes test and a due-diligence checklist for institutions deciding how to internationalize.
Key findings
- New study visas issued by the United States, United Kingdom, Canada and Australia fell by about 38 percent between 2023 and 2025, according to an estimate by The PIE News and Higher Insights that uses US data only to September 2025.
- UK sponsored study visa grants in the year to June 2026 numbered 383,455, 41 percent below the 2023 peak, while 35.8 percent of English providers ran a deficit in 2024-25.
- Canada approved 75,372 new post-secondary study permits in 2025, 64 percent fewer than in 2024, as applications fell 55 percent and the approval rate dropped to 35.7 percent.
- Japan's international student total reached 408,069 in May 2025, but only about 37 percent were in universities or graduate schools, by our calculation from the official survey tables.
The paper has 2 more findings, the full evidence review and the framework.
A chart from the paper
New study visas or nearest equivalent in 2025, six destinations
New study visas or equivalent, 2025 (visas, permits or students)
What is inside
- Executive summary and key findings
- Why this matters now
- What the evidence shows
- Quality and recognition: the weakest joint
- Where the evidence is weak or contested
- A practical framework: the Four Routes test
- Case snapshots
- What to measure
- Risks and open questions
- Recommendations for universities, educators, edtech leaders and policymakers
- Methodology, limits and 35 references
One recommendation for each audience
For university leaders
Rebuild the international budget on a downside case, and stop forecasting growth in entrants that the visa data do not support.
For educators
Build shared assessment standards and moderation into partner and offshore programs from the first cohort.
For edtech leaders
Design guidance and admissions tools for students who compare several countries, with clear information on visa cost, timing and approval.
For policymakers
Model the effect on demand before imposing caps, and publish approval rates, processing times and rule changes on a predictable timetable.
This paper is desk research completed in October 2026. We reviewed official statistics and policy documents from the United Kingdom, Canada, Japan and UNESCO, regulator and sector-body reports, peer-reviewed studies, and specialist journalism. Some national figures (Germany, France, Australia) reach us through specialist press reports, and two studies were read as abstracts; the text says where. Each figure was checked against a page opened for this paper or a fact-checked WAC Spotlight article. Estimates and our own calculations are marked. The paper reports no survey, interviews or new dataset, and the framework has not been tested in use. The cover picture is an AI-generated illustration. Send a correction
More white papers
The Proof-of-Skill Gap: Why Skills-First Hiring Stalled
What Can a Grade Still Prove? Rebuilding Trust in Assessment After AI

AI That Teaches: When Generative AI Builds Learning That Lasts
From the same centre
See what the Centre for Internationalization works on, with its analysis and the news in its field.